Western blotting is by far the most widely-used method for protein identification and relative quantitation and is therefore employed in most labs as a routine procedure for protein analysis. In a western blotting protocol, the proteins are separated on a polyacrylamide gel, subsequently immobilized on a membrane and then probed with a specific antibody recognizing the protein of interest (or its epitope) and is visualized through fluorescent or chemical means. For studies investigating the presence or absence of a certain protein, western blotting is a straightforward procedure. With proper controls, the method provides a definitive answer regarding the presence or absence of the protein based on whether the bands of interest can be visualized or not. However, when it comes to a quantitative analysis of the protein, the method is not a simple procedure. There are several factors affecting the quantitative aspect of western blotting – many of which can be attributed to variabilities in experimental procedure and conditions. For example, simple pipetting errors in sample loading could lead to variabilities in the quantitative data obtained after a laborious western blotting procedure, leading to misinterpretation of data.
Normalization – a way to control for experimental variations
Quantitative western blot is generally used to investigate differences in the amount of the protein of interest with respect to different experimental conditions, time points, developmental stages, relative abundance in various tissues. The underlying theme in all these is the assumption that the overall amount of protein does not change due to anything else other than the set experimental condition, so that the quantitative data obtained in terms of target band intensity after detection could be genuinely attributed to direct changes due to the variable being tested. A commonly adopted method to avoid inaccuracies in data quantitation is to compare the signal intensities of bands obtained for the protein of interest to those obtained for a control protein whose expression presumably remains constant across the different conditions tested (a process known as normalization). Traditionally, housekeeping proteins (HKP), such as actin, tubulin, GAPDH, have been used as normalization controls in western blotting.
Are housekeeping proteins proper controls for normalization?
Until recently, housekeeping proteins have been unequivocally accepted as the accepted method for use as internal controls for the purposes of normalization. Their highly conserved nature, ubiquitous presence and abundance in cells, easy availability of antibodies against them, and the preponderance of literature using them as internal controls render them as easy and obvious candidates for use as controls. However, in recent years, the practice of using housekeeping proteins as internal controls has come under greater scrutiny for various reasons:
(i) Expression of HKPs is not constant after all:
Use of HKPs for normalization purposes generally assumes that their expression is constant and does not change with experimental conditions. However, recently several studies examined the veracity of this assumption in depth and indicated that the expression of HKPs can change with different experimental conditions, developmental stages, differences in the age or type of cells or tissues or due to post-transcriptional regulation. Such results question the validity of the use of HKPs as internal controls and suggest rigorous testing and validation steps before using them for western blot normalization.
(ii) Use of HKPs involves additional steps increasing time, cost, and variability
Using HKPs for normalization often entails repeating several steps the western blotting procedure for quantitation of these HKP proteins. Membranes that have been probed for the protein of interest are then interrogated once more--in a process known as stripping and reprobing--by reversing the target antibody binding through washing steps, and then incubated once more with HKPs. Apart from the ostensible increase in cost and time, this procedure also introduces additional variability in results. In addition to protein load, other factors such as antibody concentration, the chemiluminescent substrate and the image acquisition method used also need to be standardized and validated. Such stringent validation is usually not performed either because of lack of awareness on the potential problems arising from the use of HKPs or because researchers normally don’t possess enough time to carry out these additional precautionary measures.
(iii) Intensity of HKP bands are usually at saturation levels resulting in erroneous quantitation
Housekeeping proteins are essential components of cellular viability, and are therefore normally expressed in high abundance. As a result, very small amounts of protein sample are sufficient to visualise these proteins. Conversely, many proteins of interest are often expressed in much smaller quantities and require a substantially more protein sample in order to be detected. Because of this discrepancy, the amount of protein sample analyzed is often biased towards the protein of interest rather than toward the desire to detect optimal amount of HKPs. Often times, the optimal load requirement for HKPs is overlooked as researchers are focused on the detection of their protein of interest. This results in substantially saturated HKP bands in relation to the bands of proteins of interest, introducing issues when using such values for relative quantitation. With the advent of remarkably sensitive chemiluminescent reagents that can detect femtogram levels of proteins, CCD cameras, and sophisticated imaging and analysis systems, detecting low levels of proteins of interest has become an easier task than it has been in the past. With that level of sensitivity in detection, differences relative to saturated bands of HKPs could be overamplified and such normalization could lead to seriously erroneous interpretation of results.
Publications express concerns over western blotting protocols
There have been a series of retractions of scientific papers as a result of problems with western blotting data and several journals have expressed concerns regarding the lack of proper guidelines, requirements, and rigor. A number of journals have published editorial articles, including Science, that call out common principles and guidelines for publishing research, towards the goal of greater reproducibility. The Journal of Biological Chemistry (JBC) updated its guidelines to reflect the rigor recommended in the guidelines as a requirement. The JBC guidelines discuss at length the problems with normalizing against housekeeping proteins, caution against the use of HKPs for normalization and state a preference for performing total protein normalization (TPN); that is, using the signal from the entire protein sample as an alternative to HKPs.
Total Protein Normalization (TPN) as an alternative to normalization against housekeeping proteins
TPN is a simple and straightforward method for protein normalization and avoids several of the potential experimental variations providing more accurate quantitation of proteins. In this method, proteins of interest in each lane are normalized against the total proteins in that lane and therefore normalization is not dependent on the expression of a single housekeeping protein. Total proteins in a lane can be measured by staining gels with Coomassie Blue or the membranes with Ponceau S. Coomassie Blue is an irreversible process, and therefore requires samples run in duplicate. Ponceau S is a reversible stain that requires great care in order to achieve uniform staining, and just as importantly, destaining. An alternative method to measuring total proteins in a lane is to use the stain-free method. The stain-free technology exploits the unique fluorescence signal of a UV-induced tryptophan modification. The total protein fluorescent signal can be measured both in the gel as well as on a blot after transfer.
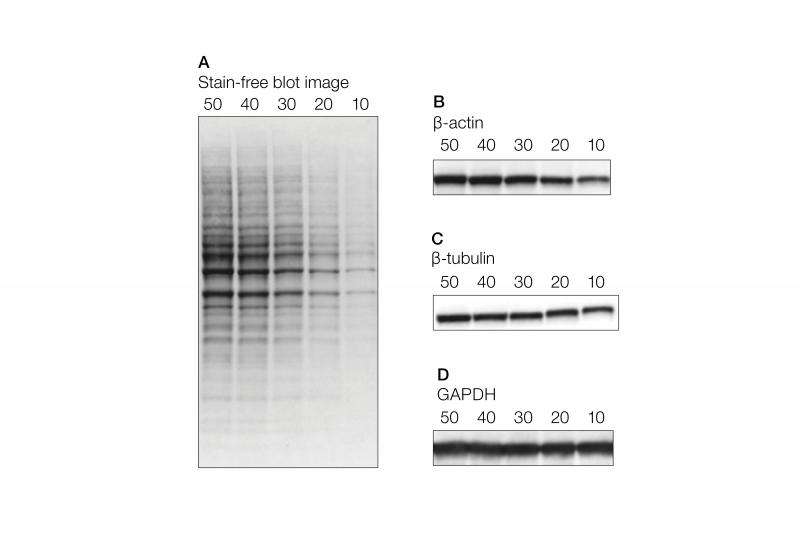
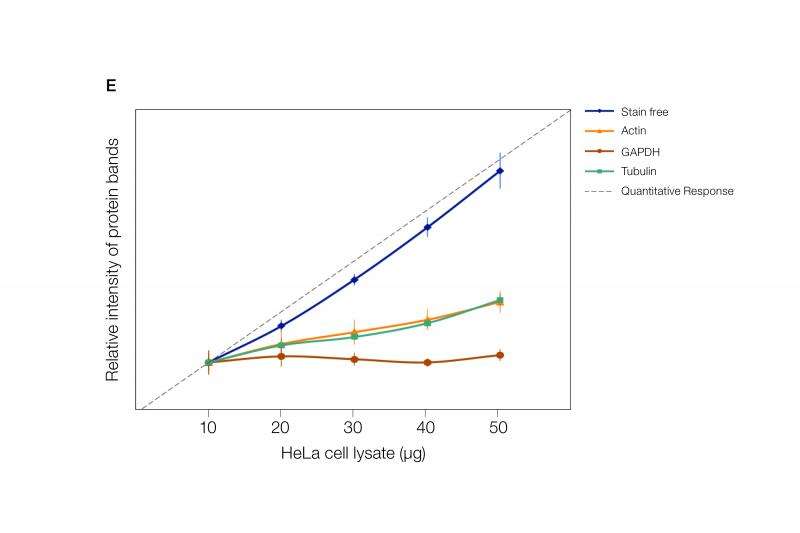
Some commercially available methods incorporate total protein normalization with stain-free visualization. This combination shows excellent linearity in signal up to 50 ug of protein in a serial dilution, whereas the signal intensities from the housekeeping genes are not linear (Figure 1). The measurement of linearity of the signal against the amount of protein loaded is a very critical aspect of protein quantitation. This has to be done for the protein of interest as well as for the protein to which it is normalized. Typically, such experiments are never performed. JBC guidelines strongly recommend providing linearity measurement data.
Conclusion
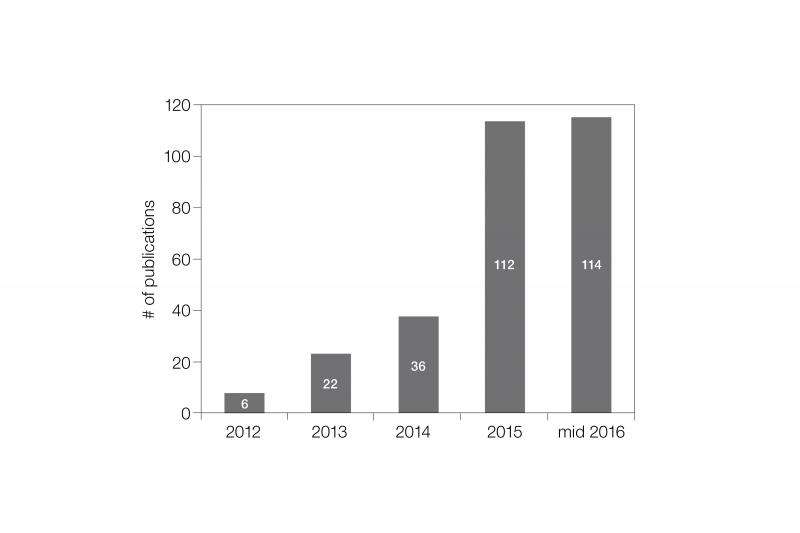
The increased awareness of the problems associated with normalization using housekeeping proteins has generated stricter demands from publications for using more reliable alternative methods for quantitating western blot data. Total protein normalization has been recognized as reliable and preferable method for normalization by journals like JBC that publish extensive amount of western blot data. There has been an exponential growth in the number of publications using the stain-free and total protein normalization method for western blotting (Figure 2). With the top journals raising the minimum required standards and defining the new normal using total protein normalization, the utility of using western blotting for quantitation of proteins is turning from being suboptimal to phenomenal.


